

Understanding India's economy through its stock market: 1970-2024
A historical study using market capitalization data

Bogged down by corruption and excessive state control for far too long, reformed in 1991, and always one trick away from realizing its true potential, the Indian economy is finally the fastest growing large economy in the world. Privatization and the equity-markets have been some of the key factors behind this achievement, and young affluent Indians tend to judge India’s economy primarily through market-sentiment: we are today more bullish than ever before.
So, this is an attempt to understand the Indian economy from 1970 until 2024 through its equity markets, using market capitalization (market cap) as our primary analytical tool. A company’s market cap is an estimate of its “size” based on how much its outstanding shares are worth; thus, the total market cap of all companies in a country or in a sector is an estimate of how much that country’s economy or sector is worth from an investor’s lens.
Growth, confidence and maturity of markets (1970-)
The total market cap of listed companies in India was under 5 billion USD in 1970, when the country’s GDP was ~60 billion USD, viz. market cap was 8% of GDP. The trend began to change rapidly after liberalization in 1991, and today India’s GDP is 3.5-4 trillion USD, and its total market cap is at over 5 trillion USD (130% of GDP).

A “Market Cap to GDP ratio” (Buffett Indicator) less than 50% is indicative of a highly undervalued market, whereas a number greater than 100% suggests that the stock market is overvalued compared to the underlying economy - an effect of highly bullish sentiment. For comparison, the Buffett Indicators for various countries are as follows:

Growth in market capitalization often leads to GDP growth, as companies are valued based on their future prospects and investments that will drive the next waves of growth (and therefore growth of the underlying economy). The below graph shows how market played catch-up to the underlying economy until ~2000 (callout in chart: Undervalued market). After this period, market growth has continued to outpace real GDP growth.
The 2020-2024 numbers for GDP growth would have possibly been even higher, if not for the Covid-19 impact. As it stands, the market continues to run considerably faster than the broader economy, which is seen as the concerning K-shaped recovery.

Small, big and giant companies (1970-)
As India’s equities market has grown, it has matured and become more broad-based. From 1970 until about 2000, all stock-market wealth was concentrated in less than 100 companies. In fact, the top 10 private companies accounted for more than 70% of India’s market capitalization in 1970; this came down to 60% by 1990 and 25% by 2010. During Covid-19, investors doubled down on companies they felt were “too big to fail” and hence their contribution to market cap rose slightly, but the contribution of the 10 biggest companies is at an all-time-low of ~20% today.
This shows how the market is getting more broad-based, and wealth is being spread out in more hands rather than getting more concentrated: a result of free-market capitalism.

Companies in India’s Nifty 50, Nifty 100 and Nifty 500 indices contribute to 65%, 78% and 96% of the country’s total market cap respectively.
Large Caps (market cap > Rs 20,000 cr) contribute to 70% of total market capitalization, Mid Caps (between Rs 5,000 cr and 20,000 cr) contribute 20% and Small Caps (<5,000 cr) 10%. The split in almost identical in the USA, where large-caps have a market cap of $10 billion or more, and mid-caps are between $2 billion and $10 billion. The 70:20:10 representation is also seen in other major economies like the UK and Germany.
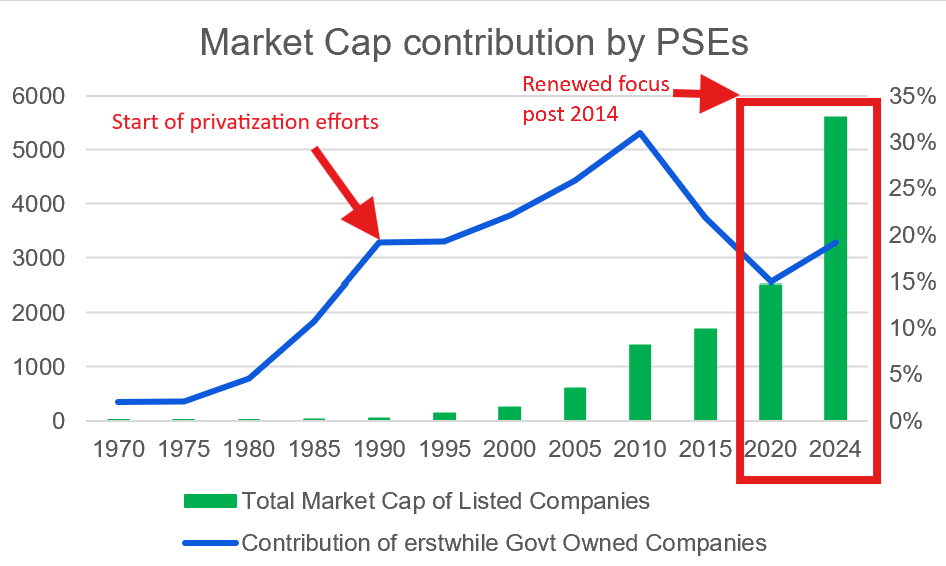
State-owned to Public: India’s disinvestment story (1991-present)
The Indian government's disinvestment agenda began in 1991, when the focus was on reducing the fiscal burden of public sector enterprises (PSEs) and improving their efficiency through privatization and stake sales. BPCL, Hindustan Zinc, VSNL, MTNL, SAIL, etc. were part of this first wave of privatization.
But progress was slow until 2014, when the Modi-government emphasized a more aggressive approach to privatization. The Department of Investment and Public Asset Management (DIPAM) was established to oversee these efforts. Since 2014, disinvestment receipts have exceeded ₹4.3 lakh crore (over $500 billion). IPOs and share sales in LIC, Air India (privately held, no market cap), REC, Power Finance Corporation, Hindustan Aeronautics and SBI Life Insurance are some of the successes of this period.
Disinvestment has generally contributed to an increase in India's total market capitalization by allowing public sector undertakings (PSUs) to list on stock exchanges. These listings have facilitated greater public participation in the equity markets, which can lead to a broader base of investors contributing to market capitalization growth.
As of 2024, ~20% of India’s total market capitalization is contributed by erstwhile PSUs.
Rise and fall of sectors (1991-present)
A sectoral study of India’s markets results helps us clearly visualize three distinct phases: (I) the period until economic liberalization in 1991, (II) early gains and subsequent plateau in the 1991-2020 period, and (III) growth phase post 2020.

In the first phase, old industry such as cement, steel, textiles and heavy machinery flourished and made up over half of the market. Tata Steel, Bombay Dyeing, Century Textiles, L&T and United Spirits were dominant players in this period; large government-controlled enterprises were kept away from the stock market (hence no market cap).
In the early ‘90s, the economy found a new gear with liberalization, deregulation and privatization: the IT boom took place and catapulted Infosys, Wipro, Satyam, HCL and TCS into multi-billion-dollar orbits. Banking and finance began to mature, and private banks like HDFC Bank and ICICI strongly established themselves. The third aspect of this phase was the consolidation of conglomerates - India was no longer just about Tata and Birla; Reliance, Adani, Bajaj, ITC and others were here to stay.
In its most recent phase that saw the impact of Covid-19 as well as the post-pandemic years, the markets have seen growth in new-age sectors such as aviation (via Indigo), hospitality, and internet-services (such as Zomato, Nykaa, Policybazaar, Delhivery, Paytm, etc). There has also been a massive growth in the banking, insurance and financial services sector, which now contributes to nearly 30% of the market.
Today, India’s biggest sectors are Banking & Financials (30%), IT (15%) and Consumer Discretionary* (12%). In the USA, the three biggest sectors are Technology (20%), Financials (15%), and Healthcare (15%). China’s top three sectors (as per market cap) of Financials (30%), Consumer Discretionary (15%) and IT (12%) bears some resemblance to India’s market. Japan’s and Germany’s markets are dominated by Industrials (25-30%).
* Consumer Discretionary comprises of industries such as Automobiles & Auto-parts, Jewellery, Durables & Furniture, Electronics, etc
Change management, survival and growth: the big successes
In a constantly changing market where sectoral preferences change and new competitors enter tightly contested spaces, eleven large business houses contribute nearly one-third of all market cap. How is this possible?

Their secret lies in strengthening of core areas, diversification and doubling down on new opportunities. The Tata group has Tata Consultancy Services (TCS), Tata Motors, Tata Steel, Tata Power, and Tata Chemicals as its key portfolio companies; Reliance has Reliance Industries, Jio Financial Services and Reliance Retail; Adani has its holding company Adani Enterprises, Adani Ports, Adani Green Energy, and Adani Power.
Many of these groups started out in sectors which are no longer relevant to them: the Tatas started in trading and textiles, Reliance also started in the textile trade, and Birlas in cotton, jute and opium. The Aditya Birla group is still connected to textiles via Grasim Industries, Aditya Birla Fashion and Retail, and Century Textiles, but their cement business (UltraTech) is worth more than all these put together.
Billion-dollar companies that have failed
There is a sense of invincibility as large companies grow and cross a billion dollars in market cap. But not all of these successes go on to become corporate behemoths like Reliance or Adani. Some of the notable failures in the recent past have been Reliance Communications (telecom), Kingfisher (aviation) and the UB Group, Jet Airways (aviation), Satyam (IT), Binani Cement, Jaypee Infra (real estate), and Essar Steel.

Bets that went wrong, poor corporate governance, overleveraged balance sheets and inability to service debt are the usual reasons for failure. The wider insight is almost cliche but is still worth calling out: what takes a company from 0 to 1 (billion), is not what will take it from 1 to 100.
Brave new market
Every day, India inches out of its socialist past into a more market-oriented future. The old approach of state-control on key sectors failed to product the intended outcomes of equitable growth, food security and poverty alleviation. Today, the government ostensibly wishes to play a smaller role in big industry, but state-owned enterprises still dominate sectors like energy and banking. While substantial progress has been made in liberalizing the economy and fostering growth, the challenge remains to balance market dynamics with social equity.
P.S. All data used in this post is from publicly available information about current and past market cap of various companies. Send me a message if you would like to get the spreadsheet I made while researching this post.